What is Granular KPI Data?
Granular KPI (Key Performance Indicator) data is a comprehensive set of metrics that track the performance of a company's various segments and businesses. It includes a broad range of data points, such as subscriber numbers, transaction volumes, customer numbers, renewal rates, and much more.
These are just simply examples, we have tens of thousands of such metrics for investors to utilize for analyzing specific businesses and gaining an edge.
By tracking these KPIs, investors can gain valuable insights into a company's operations and make more informed decisions.

What about Segments?
In addition, we track the business segments for these public companies:
- By business segment
- By geography
This in combination with the business KPIs, you have a complete view of the underlying fundamentals.
How Often is the Data Updated?
The data is updated immediately after quarterly results are released for the company typically it is live on our website within 5-30 minutes.
This means you can be confident that the companies you track you will have an aggregated view of the underlying fundamentals during a busy earnings season.
Our Data Coverage
Our company's Granular KPI data covers a vast array of companies, including the entire S&P 500, TSX 60, hundreds of large-cap international companies, and the Nasdaq 100. Our database includes tens of thousands of data points for each company, covering every aspect of their business.
Use Cases
The granular KPI data we provide can be used in many different ways.
Here are just a few examples:
- Comparing Stocks on a Granular Level
- By using our data to compare companies within the same industry, investors can gain a better understanding of how each company is performing relative to its peers. For example, by comparing the subscriber numbers of Netflix subcribers and Disney+ subscribers, investors can determine which company is gaining more market share in the streaming industry.
- Understanding the Business from a Fundamental Level
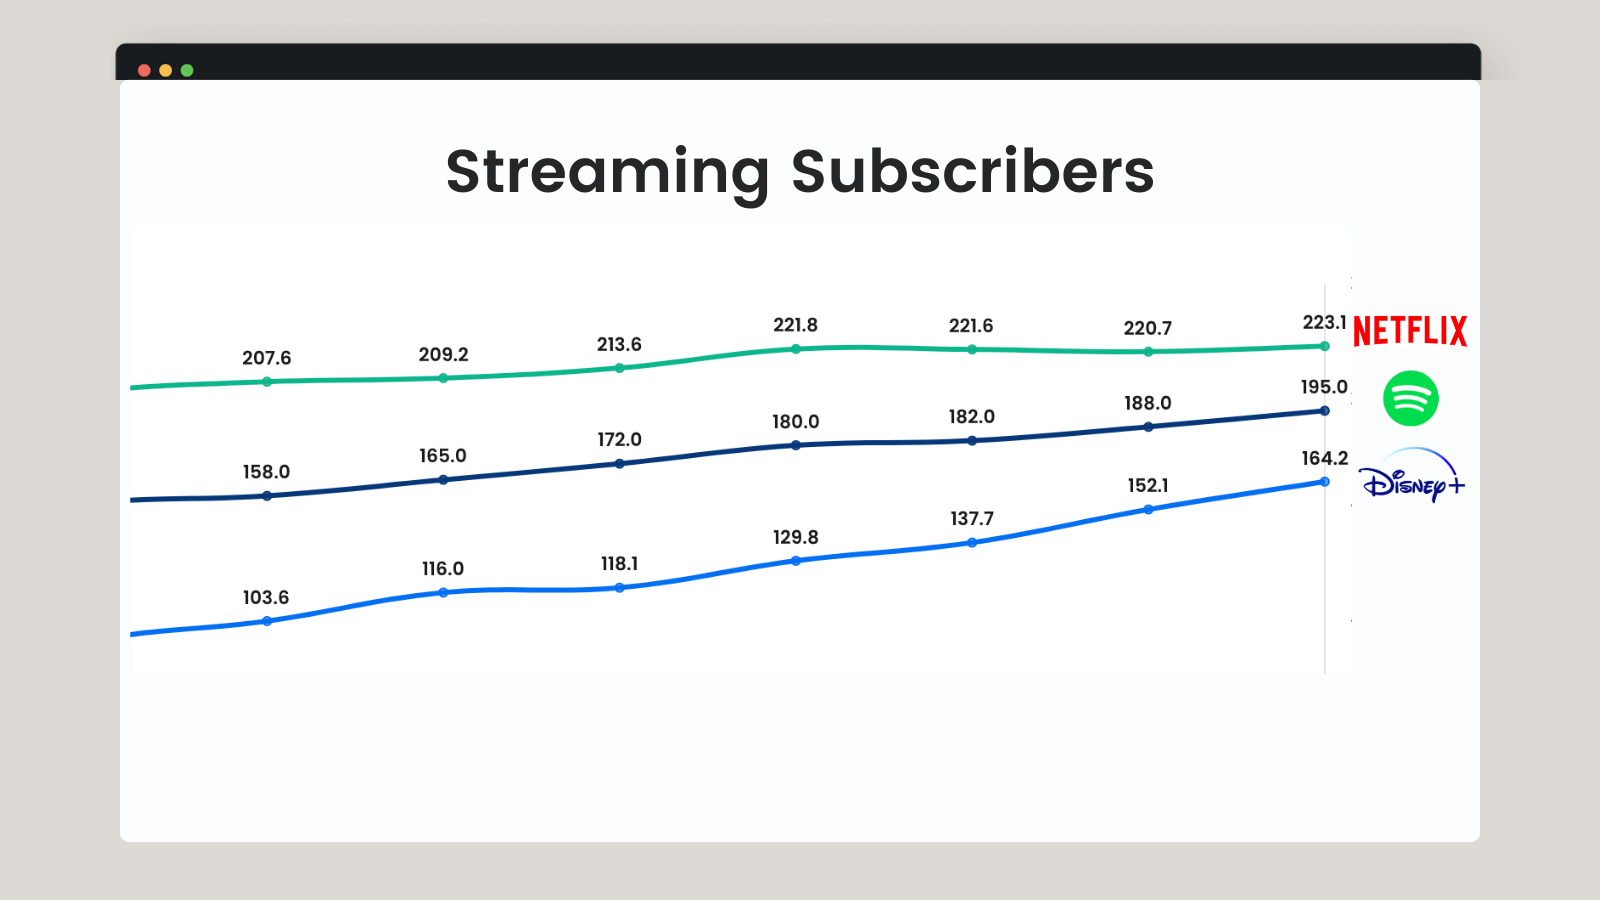
Our granular KPI data provides investors with a deep understanding of a company's business fundamentals. By tracking metrics such as transaction volumes and renewal rates, investors can gain insights into how a company's operations are performing. This information can help investors make more informed decisions about whether to invest in a particular company or not.
Why Use Our Data?
Portfolio managers and analysts around the world are tapping into this data set to ramp up on new ideas and stay on top of portfolio companies with ease.
Our Granular KPI data provides investors with a level of detail that is not available through traditional financial reports. Instead of having to sift through public filings manually, our database provides investors with all the data they need in one place. By saving time and providing comprehensive data coverage, we make it easier for investors to make informed decisions about their portfolios.
- Saves time and effort by providing comprehensive data coverage in one place, eliminating the need to manually search through public filings.
- Provides investors with a competitive edge by offering detailed insights into a company's performance, allowing for informed investment decisions.
- Enables investors to identify emerging trends and patterns in a company's operations, which can be used to anticipate future growth or decline.
- Offers the ability to track multiple KPIs for a single company, providing a holistic view of its performance and allowing for a more accurate analysis of its business operations.
- Allows investors to compare companies within the same industry on a granular level, providing a better understanding of how each company is performing relative to its peers.
- Provides a historical view of a company's KPI data, allowing investors to track its performance over time and identify any long-term trends or patterns.
- Enables investors to monitor changes in a company's business operations and identify potential risks or opportunities.
- Provides data on a company's performance at the business segment level, allowing for a more in-depth analysis of its operations.
- Offers a user-friendly platform with intuitive search and filtering features, making it easy to find the data investors need.
Don't just take our word for it
What happy customers have said:
"Finding myself on FinChat.io first when starting to seriously consider a stock for further research. The KPI and segment data is amazing."
-Andrew Sather, Founder of Sather Research
"This is really well done and I'm super impressed."
-Chase Lee, Founding Partner, Doxa Capital
"FinChat is very impressive. They have broken down the KPIs for each business."
-Brayden Russel, Independent investor





As an investor, it's essential to have access to the right data to make informed decisions. Our company's Granular KPI data provides investors with a wealth of information that can help them gain an edge in the market.
With coverage of the entire S&P 500, TSX 60, hundreds of large-cap international companies, and the Nasdaq 100, our data can be used to compare stocks on a granular level and gain a deep understanding of a company's business fundamentals.
So why waste time manually searching through public filings when you can have all the data you need in one place?
Fintech = financial technology , so what are they?
The first article I have read: -
https://www.koyfin.com/blog/best-bloomberg-terminal-alternatives/
I have signed up 2 free charting accounts: -
1. Koyfin. https://app.koyfin.com/
2. TradingView. https://www.tradingview.com/
My next move will be :
暫時試用免費的。它們的數據包含香港交易所。冇 Bloomberg Terminal 咁貴,相信耀財等只服務其客戶。有些分柝工具,各有各強項,宜申請一個免費戶口玩玩先,摸熟其脾性。
Invesopedia 投資百科解釋某些財經名辭很詳細,我最近見到這個比數叫 EV/Sales LTM 。 EV 即 enterprise value 企業市值,LTM = Last twelve months. 過去12個月的銷售額。應是股票銷售價。
https://www.investopedia.com/terms/e/enterprisevaluesales.asp
在我的試用賬戶,有7日全功能期,有個市場分析很好用,看看以下圖表:

7隻最大市值的公司,另另舍舍拋離其他公司,即所有資金都押在這7隻股,你話喺咪K型。
數據:
https://docs.google.com/spreadsheets/d/1sv-YKqBqsqUau54v67zZC_UXLCAl1HwqsJ3Ssd9w-3o/edit#gid=1102734

